I had a hot loop I could not get any faster. Plain for i := 0; i < n; i++,
two slice reads, one add, return. On paper that is three or four x86
instructions per iteration. In practice it was running at about half the
throughput I expected, and perf kept pointing at the same two lines.
When I finally dumped the assembly, the answer was sitting right there: a
CMPQ followed by a conditional jump to runtime.panicIndex on every read.
The compiler was leaving the runtime bounds check in. The “work” of the
loop was 8 bytes of useful instructions, plus 6 bytes of “is this index
still safe”, every single iteration.
This is the fourth post in what was supposed to be a trilogy on the Go
compiler: after following an int-from-string lookup down into the
compiler itself, budgeting
inlining, and reading escape-analysis
output, it would be rude to skip the one
where rewriting two lines wins back 22% on the same hardware. Quartet it
is.
All numbers below are real, on go1.21.13 linux/amd64, AMD Ryzen 5 9600X,
benchstat on 15 runs at -cpu=1. The scratch project is a handful of
files long.
The flag that tells you what is going on
The bounds-check elimination pass (BCE) lives in the SSA backend. It has a
debug flag that prints every IsInBounds and IsSliceInBounds the prover
could not discharge:
go build -gcflags="-d=ssa/check_bce/debug=1" ./...
Each line of output is one runtime bounds check that survived into the generated code. Zero lines means every index in the file was proved safe at compile time. The flag is older than module support and it is still the fastest way to find loops worth tightening.
The second tool is just -gcflags="-S". Read the disassembly. If you see
a CALL runtime.panicIndex in the trailer of your hot function, the
prover gave up somewhere.
Patterns the prover already handles
Before showing off the wins, the honest part. The prover on 1.21 is good enough that a lot of the “tricks” you find on older blog posts no longer buy anything. These three loops all generate the same hot path with zero bounds checks:
// 1
for i := 0; i < len(s); i++ { sum = sum*31 + uint32(s[i]) }

// 2
for _, b := range s { sum = sum*31 + uint32(b) }

// 3
n := len(s)
_ = s[n-1]            // the "classic" hoist hint
for i := 0; i < n; i++ { sum = sum*31 + uint32(s[i]) }
The first one already gets BCE because i is bounded by len(s) in the
exact form the prover understands. The third one used to be the canonical
recipe; on 1.21 it is just clutter. If a hot loop matches one of these
shapes, leave it alone.
The patterns the prover still misses fall into two buckets I keep hitting in real code.
Pattern 1: look-ahead, s[i+1]
The textbook one. We are computing a sum of adjacent pairs, which shows up in delta encoders, simple stencils, and any “compare with neighbour” loop:
func SumNextNaive(s []uint32) uint32 {
    var sum uint32
    for i := 0; i < len(s)-1; i++ {
        sum += s[i] + s[i+1]
    }
    return sum
}
s[i] is fine. s[i+1] is not. The loop guard says i < len(s)-1, but
the prover does not propagate that into a “i+1 < len(s)” fact for the
second read. So we get this in the body:
ADDL   4(AX)(CX*4), DI      ; s[i+1], speculatively
ADDL   DI, DX                ; sum += ...
MOVQ   SI, CX                ; i = i+1
LEAQ   -1(BX), SI            ; len(s)-1
CMPQ   CX, SI
JGE    out
LEAQ   1(CX), SI             ; i+1
MOVL   (AX)(CX*4), DI        ; s[i]
CMPQ   BX, SI
JHI    body                  ; bounds check for s[i+1]
JMP    panic
...
CALL   runtime.panicIndex(SB)
Two compares per iteration, plus a tail that calls into the runtime.
ssa/check_bce/debug=1 flags exactly one IsInBounds here, on the
s[i+1] access. The prover is honest about what it could not prove.
A 3-second CPU profile of just this benchmark looks like a single tall stack:

pprof -top reports 99.15% of samples inside bce.SumNextNaive and
essentially nothing anywhere else, no runtime.panicIndex frame, no
scheduler. That is exactly what you would expect: the extra compare and
the conditional jump to the panic trailer are inlined into the function
itself, they only show up as wider per-iteration cost on the same frame.
The point of the flamegraph is the shape: one function, one block, all
the time. There is no kernel or runtime to blame, the cycles really are
being burned on bounds-checking arithmetic.
The fix is to re-slice the input once, up front, into the two views the loop actually wants:
func SumNextHint(s []uint32) uint32 {
    if len(s) < 2 {
        return 0
    }
    n := len(s) - 1
    head := s[:n:n]
    tail := s[1 : n+1 : n+1]
    var sum uint32
    for i := 0; i < n; i++ {
        sum += head[i] + tail[i]
    }
    return sum
}
The 3-index slice expressions (s[:n:n] and s[1:n+1:n+1]) are doing the
real work. They tell the compiler “this is a slice whose length is exactly
n”, and the slice operation itself is checked once on entry. Inside the
loop, head[i] and tail[i] with i < n are both proved safe in one
shot. The debug flag reports a single IsSliceInBounds outside the loop
and zero inside it.
The body collapses to five instructions:
MOVL   (AX)(DX*4), SI       ; head[i]
ADDL   4(AX)(DX*4), SI      ; + tail[i]   (same backing array, +4 byte offset)
INCQ   DX
ADDL   SI, BX               ; sum += ...
CMPQ   DX, CX
JLT    body
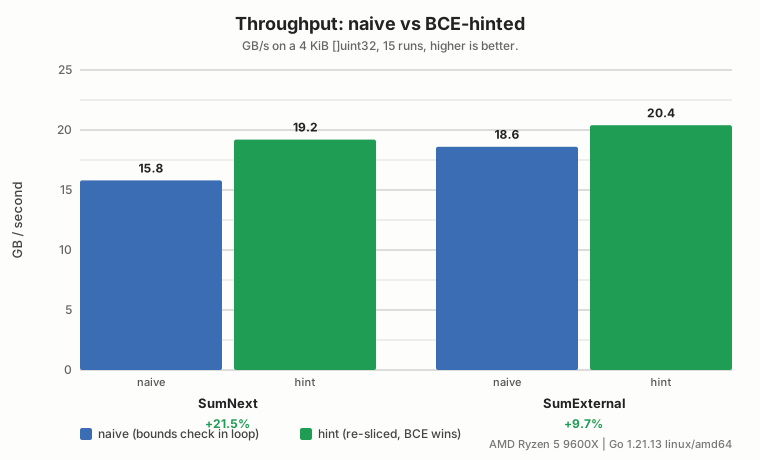
No panic trailer, no second compare. benchstat, 15 runs each:
name        old time/op    new time/op    delta
SumNext     1.04µs ± 8%    0.85µs ± 3%   -18.13%  (p=0.000 n=15+14)

name        old speed      new speed      delta
SumNext     15.8GB/s ± 7%  19.2GB/s ± 3%  +22.07%  (p=0.000 n=15+14)
Reading 4 KiB of uint32s goes from 15.8 GB/s to 19.2 GB/s. The CPU was
not the bottleneck; the redundant branch was.
Pattern 2: length passed as an argument
This one bit me in real code. Imagine a helper that some caller has
already decided to walk only n of the elements of s:
func SumExternalNaive(s []uint32, n int) uint32 {
    var sum uint32
    for i := 0; i < n; i++ {
        sum += s[i]
    }
    return sum
}
It looks fine. The caller is well behaved. But the prover sees n as a
black box int parameter, unrelated to len(s). So every s[i] is
checked, and the loop carries the panic tail:
MOVL   (AX)(CX*4), SI
INCQ   CX
ADDL   SI, DX
CMPQ   DI, CX
JLE    out
CMPQ   BX, CX               ; the actual bounds check
JHI    body
JMP    panic
The fix is one line:
func SumExternalHint(s []uint32, n int) uint32 {
    s = s[:n]
    var sum uint32
    for i := 0; i < n; i++ {
        sum += s[i]
    }
    return sum
}
The re-slice teaches the prover “from now on, len(s) == n”. Indexing
s[i] with i < n is now obvious. The check moves from inside the loop
to a single panicSliceAcap on entry, executed once per call. The hot
body drops to four instructions plus the back-edge compare. Numbers:
name        old time/op    new time/op    delta
SumExternal  883ns ± 9%     803ns ± 3%    -9.12%  (p=0.000 n=15+13)
Ten percent on a loop that was already as tight as I knew how to make it. Side by side, both patterns:
Things the prover still does not get
While I had the SSA debug flag turned on I went looking for what else it flags. Two patterns that come up over and over:
- Indexing two slices of the same length without re-slicing.
if len(a) != len(b) { ... }is not enough; the prover does not carry that invariant into the body. Re-sliceb = b[:len(a):len(a)]and the check onb[i]disappears. - Index arithmetic with a constant offset other than +1.
s[i-1],s[i+2],s[i*4]all trip it. The same re-slice trick applies, you just slice outs[1:]ors[2:]or whatever the offset is.
Both of these are mechanical rewrites. The cost is two or three extra lines of slice juggling at the top of the function; the win is a tighter inner loop and, often, the compiler suddenly deciding the loop is small enough to inline somewhere else (which is the connection back to the inlining-budget post, where every byte of generated code matters).
The honest caveat
Two things to remember.
First: I have caught past versions of myself “optimising” away a bounds
check that the prover had already eliminated. When I bisect across Go
releases, hand-tuned hot loops occasionally regress because the prover got
smarter and my workaround now looks like dead code that the compiler
cannot quite eliminate. Always re-run -d=ssa/check_bce/debug=1 after a
Go upgrade. If the only IsInBounds lines are in cold init code, your
hint is now noise.
Second: bounds-check elimination is a peephole optimisation in the truest sense. It moves a compare out of the inner loop. It does not vectorise your code, it does not change cache behaviour, it does not let the compiler reorder anything fundamental. The wins are 10 to 25 percent on loops that were already CPU-bound and tiny, and zero on loops that were bound by memory or doing real work per iteration. The biggest practical benefit, in my experience, is that the loop body becomes small enough to inline, which then unlocks the gains from the escape-analysis and inlining work.
So the recipe is: -d=ssa/check_bce/debug=1 first, then -S to confirm,
then benchstat. If the prover is already happy, do nothing and go work
on something that matters. If it is not, a 3-index slice expression is
almost always the smallest change that fixes it.