A while back I had a hot loop that profiled like a heap-allocation
machine gun. pprof blamed runtime.mallocgc. The code looked
innocent. The fix turned out to be a one-line signature change, and
the compiler had been quietly screaming at me about it the whole
time via -gcflags=-m.
This post is the second half of a tour I started in My journey optimizing the Go Compiler and continued in What actually fits in Go’s inlining budget. Inlining decides where code runs; escape analysis decides where data lives. Six 10-line examples cover roughly 90% of what you’ll see in real Go.
Reading the compiler’s mind
Build any package with -gcflags=-m and the compiler tells you, per
line, which values it decided to put on the heap and why:
$ go build -gcflags="-m" .
./main.go:9:2: moved to heap: p
./main.go:15:9: v escapes to heap
There are three phrases worth memorising:
- “moved to heap: x” a named local was promoted to the heap.
- “x escapes to heap” a value (often the result of an expression) was allocated on the heap.
- “x does not escape” the cheerful one. Stack allocation.
-m=2 adds the full flow trace (“from x (spill) at …”), which is
how you debug a surprising escape. Everything below was compiled
with Go 1.18.
The six examples
Single file. Each function is its own story.
E1. Returning a local pointer
type Point struct{ X, Y int }

func E1() *Point {
    p := Point{1, 2}
    return &p
}
./examples.go:9:2: moved to heap: p
The address of p outlives the frame, so p has to live somewhere
that outlives the frame. This one is the textbook case and the only
escape almost everybody can predict.
E2. Storing a concrete value into an interface
func E2(v int) interface{} {
    return v
}
./examples.go:15:9: v escapes to heap
This is the one that surprises people. An interface{} is a
(type, pointer) pair. To put a non-pointer value behind one, the
compiler has to take its address, and that address has to point at
something the caller can keep. So v is boxed onto the heap. The
same thing happens every time you write var x interface{} = 42,
push a value into a []interface{}, or call fmt.Sprintf("%d", n).
E3. Closure capturing a local by reference
func E3() func() int {
    n := 0
    return func() int {
        n++
        return n
    }
}
./examples.go:20:2: moved to heap: n
./examples.go:21:9: func literal escapes to heap
The returned closure mutates n, so n has to be shared. The
compiler moves n to the heap and the closure stores a pointer to
it. With -m=2 you can see the exact reason:
E3 capturing by ref: n (addr=false assign=true width=8)
assign=true is the smoking gun. A read-only capture of an int
would be copied into the closure value and stay on the stack.
E4. make with a non-constant size
func E4(n int) int {
    s := make([]int, 0, n)
    for i := 0; i < n; i++ {
        s = append(s, i)
    }
    return s[len(s)-1]
}
./examples.go:29:11: make([]int, 0, n) escapes to heap
Note the function does not return the slice. It still escapes,
because the compiler cannot prove at compile time how big the
backing array needs to be, and Go will not put a runtime-sized
object on the stack. A constant capacity small enough to fit
(make([]int, 0, 8)) is the version that stays on the stack. The
rule is simple: non-constant size = heap.
E5. A buffer past the 64 KiB threshold
//go:noinline
func E5() byte {
    b := make([]byte, 65*1024)
    b[0] = 1
    return b[0]
}
./examples.go:39:11: make([]byte, 65 * 1024) escapes to heap
There is a hard ceiling: the compiler refuses to stack-allocate a
make whose constant size is larger than 64 KiB. Drop the size to
64*1024 and the message goes away. (For plain var b [N]T arrays
the threshold is much larger, around 10 MB on amd64. The 64 KiB
limit is specifically about make.)
E6. fmt.Println of anything
func E6(x int) {
    fmt.Println(x)
}
./examples.go:46:13: ... argument does not escape
./examples.go:46:13: x escapes to heap
fmt.Println is func(a ...interface{}). The variadic part packs
your arguments into []interface{}, which is E2 in disguise: every
single argument gets boxed onto the heap, every call. The first
line ("... argument does not escape") is about the slice itself,
not its contents. The contents always do. This is why hot logging
paths so often show up in heap profiles: an innocuous
log.Printf("id=%d", id) allocates.
The fix pattern
Out of those six, three are unavoidable consequences of what you asked for (E1, E3, E5). The other three (E2, E4, E6) are the ones worth hunting in hot paths. The rules I apply, in order:
- Make sizes constant. A
make([]T, 0, 32)with a literal cap stays on the stack when the function does not return it. A non-constant cap loses you that, every time. - Accept concrete types in hot paths. An API that takes
interface{}looks general; in a hot loop it is an allocation per call. The reverse is also true: an internal field of typeinterface{}forces every value written to it to escape. - Pass small structs by value. Once you know a struct does not need shared mutation, returning it by value lets the compiler keep it on the stack of the caller. Returning a pointer is what put us into E1.
One real benchmark
Here’s the wrapper I actually had in my code, distilled. A “sink”
that stores the last record it saw. Two flavours: the convenient
one (interface field, accepts interface{}) and the typed one
(concrete field, takes the struct by value).
type Record struct {
    ID    int64
    Code  int32
    Score int32
}

type AnySink struct{ last interface{} }
func (s *AnySink) Put(v interface{}) { s.last = v }

type TypedSink struct{ last Record }
func (s *TypedSink) Put(r Record) { s.last = r }
Both Put methods are marked //go:noinline in the benchmark so
the comparison stays apples-to-apples; with inlining the typed
version disappears entirely. The benchmark loop just calls
s.Put(makeRecord(i)) b.N times.
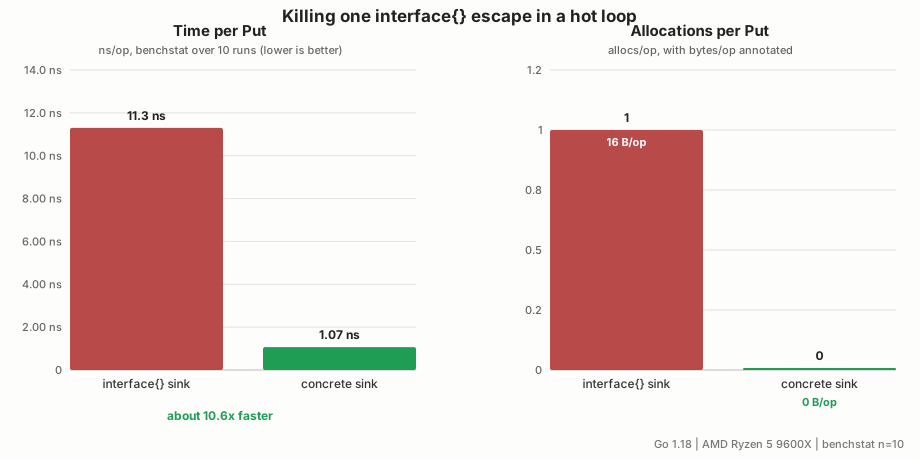
benchstat over 10 runs on Go 1.18, AMD Ryzen 5 9600X:
name           time/op
Sink/any-12    11.3ns ± 5%
Sink/typed-12  1.07ns ± 4%

name           alloc/op
Sink/any-12     16.0B ± 0%
Sink/typed-12   0.00B

name           allocs/op
Sink/any-12      1.00 ± 0%
Sink/typed-12    0.00
One allocation per call became zero. 16 bytes per call became zero. And because there is no allocator on the path any more, the per-call time dropped from 11.3 ns to 1.07 ns: about a 10x speedup, from removing one heap allocation. The compiler had been telling me this the whole time:
$ go build -gcflags="-m" .
./sink.go:17:30: v escapes to heap
That single line of -m output was the entire fix.
What I do now
When I open a new Go file in a perf-sensitive package, the first
thing I run is go build -gcflags="-m" ./... and grep for “escapes
to heap” and “moved to heap” in the files I care about. It is
ridiculously cheap signal. Most of the hits are fine. The
interesting ones are the surprises, the values you didn’t think
were leaking out of their frame.
Escape analysis is not magic. It is a small set of rules the
compiler applies very mechanically, and -m is the compiler
telling you, in plain English, which rule fired. Once you have seen
the six shapes above, almost every escape you encounter in real
code is a variation on one of them.
That closes the trilogy: the compiler can rewrite your
code, inlining decides what
becomes one function, and escape analysis
decides where the data lives. Read the -m output. It is the
cheapest performance tool Go gives you.