
I had a 4 GiB file that’s almost entirely zeros, exactly one non-zero
int64 is hiding at offset Size - 8 (the last aligned slot). The task: find
that offset, as fast as possible, in Go on Linux.
It’s a deliberately silly problem. There’s no parsing, no indexing, no
cleverness on the algorithm side. The only thing it measures is how much data
we can pull through a CPU per second. Exactly the kind of micro-task that
exposes every layer of the stack: the Go runtime, the standard library, the
kernel, the page cache, the memory hierarchy, and SIMD, including Go 1.26’s
brand-new simd/archsimd package that lets you write AVX-512 in pure Go.
Starting from the most obvious os.ReadFile + for range we get 0.75
GB/s. Thirteen variants later we’re at 49 GB/s, a 66× speedup, and
we’ll know exactly which wall we hit and why.
The setup
Test box:
- AMD Ryzen 5 9600X (Zen 5, 6c/12t, AVX2 and AVX-512)
- 15 GiB DDR5
- WSL2 / Linux 6.6 / ext4 / NVMe SSD
- Go 1.26
The haystack is exactly 4 GiB (4 << 30 bytes). I pwrite zeros over the
whole file once so the blocks are actually allocated (otherwise sparse-file
reads are free and meaningless), then plant a single fixed magic
int64 at offset Size - 8. The needle never moves, same position,
same value, across every run and every program invocation, so there is no
luck factor and the page cache state isn’t disturbed between iterations.
For every variant I run 5 timed iterations, drop the slowest and fastest, and
report the mean of the remaining three. All headline measurements are warm
cache (the 4 GiB file fits comfortably in RAM and is pre-read once before
each variant). At the end I’ll also show cold-cache numbers using
posix_fadvise(POSIX_FADV_DONTNEED).
The full source for every variant and the benchmark harness is in browsable on GitHub.
V1: The naive one
Read the whole file into memory and walk every byte:
func (S) Search(path string) (int64, error) {
    data, err := os.ReadFile(path)
    if err != nil { return -1, err }
    for i, b := range data {
        if b != 0 {
            return int64(i) &^ 7, nil
        }
    }
    return -1, nil
}
os.ReadFile allocates a 4 GiB []byte and copy_to_user’s the whole file
into it. Then a tight Go loop walks 4 billion bytes looking for the first
non-zero one.
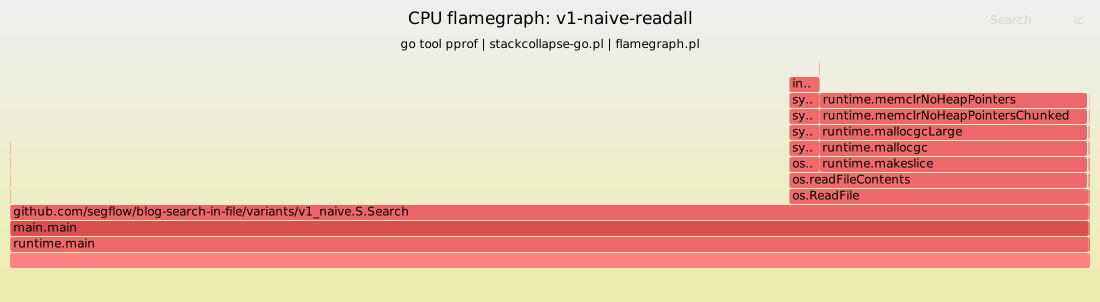
Execution time splits ~72% inside the scan loop and ~28% inside os.ReadFile (mostly runtime.makeslice zero-initializing 4 GiB of heap). The naive code is doing twice the work: allocate, copy, then scan.
Result: 749 MB/s. Most of that time is the allocation + kernel copy: asking the Go runtime to grow the heap by 4 GiB per run is not free, and once the working set blows past L3 the allocator pressure shows up clearly. This is the baseline.
V2: bufio (the textbook answer)
Every “how do I read a big file in Go” Stack Overflow answer ever:
r := bufio.NewReaderSize(f, 1<<16) // 64 KiB
for {
    b, err := r.ReadByte()
    ...
}
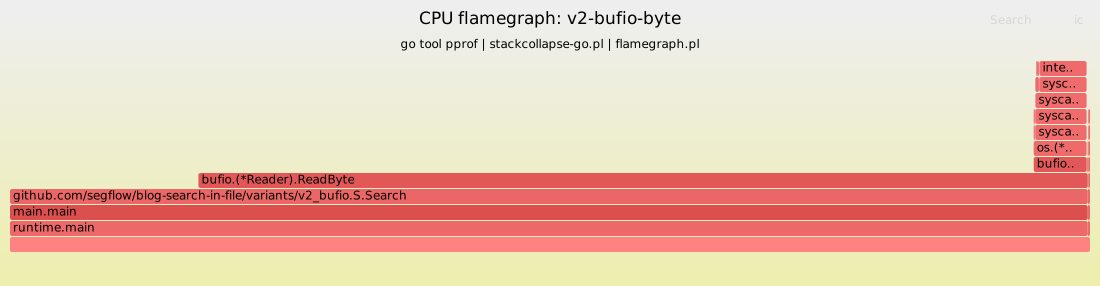
~77% of CPU time is in bufio.(*Reader).ReadByte alone. Two billion calls, two billion bounds checks, two billion increments of an offset. The actual byte comparison is the cheap part.
Result: 755 MB/s, basically a tie with naive os.ReadFile (#v1).
bufio.Reader.ReadByte is one Go function call per byte. Four billion calls.
The compiler can’t inline through it and the cost of the call dwarfs the cost
of looking at a byte. naive os.ReadFile (#v1) paid a giant allocation tax up front; bufio pays a
giant function-call tax instead. Total wall time ends up almost identical.
Lesson: don’t pay function call overhead per byte if you can avoid it.
V3: Bigger chunks, scan 8 bytes at a time
Let’s stream the file in 1 MiB chunks into a reusable buffer and process each
chunk as []uint64:
buf := make([]byte, 1<<20)
for {
    n, err := io.ReadFull(f, buf)
    words := unsafe.Slice((*uint64)(unsafe.Pointer(&buf[0])), n/8)
    for i, w := range words {
        if w != 0 { return off + int64(i)*8, nil }
    }
    off += int64(n)
    if err != nil { break }
}
Two things changed:
- One syscall per megabyte instead of one per byte. The kernel transfers
256 page-cache pages with a single
copy_to_user. - 8 bytes per iteration of the inner loop. Same number of branches and
compares as naive
os.ReadFile(#v1), but 8× the work per iteration.
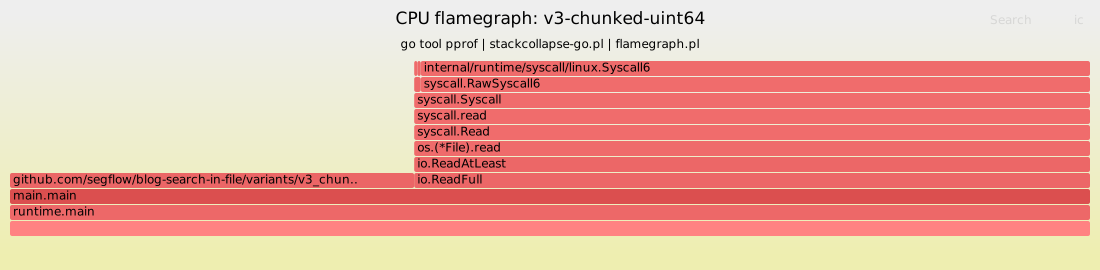
About 60% of time is in internal/poll.(*FD).Read (the read syscall + copy_to_user) and 40% in the scan loop. We’ve cleanly amortized syscall overhead; the kernel copy is now the headline cost.
Result: 13.7 GB/s, an 18× jump. This is already pretty good. Most people would stop here.
We won’t.
V4: mmap, the obvious next step
Why copy bytes from kernel space to user space when the kernel can just hand us a window into its page cache?
data, _ := unix.Mmap(int(f.Fd()), 0, size, unix.PROT_READ, unix.MAP_SHARED)
defer unix.Munmap(data)
words := unsafe.Slice((*uint64)(unsafe.Pointer(&data[0])), size/8)
for i, w := range words {
    if w != 0 { return int64(i) * 8, nil }
}
The hypothesis: same scan loop as chunked uint64 (#v3), but with the giant copy_to_user
deleted. Should be faster.
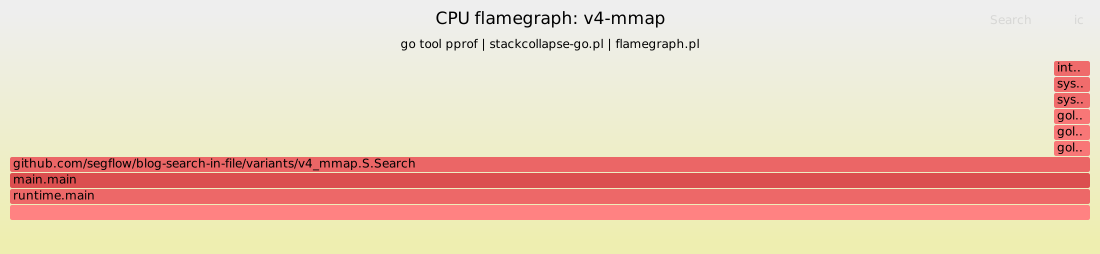
Almost 100% of the time sits inside our single S.Search frame. But what looks like “scan time” is largely minor page faults happening lazily as the loop touches each new 4 KiB page. pprof attributes the time to the userland function that triggered the trap, hiding the kernel-side cost.
Result: 13.2 GB/s, slightly slower than chunked uint64 (#v3). A surprise.
The reason is minor page faults. mmap doesn’t actually map the pages - it sets up the address-space metadata. The first time the userland loop touches each 4 KiB page, the CPU traps into the kernel, which then finds the already-cached page and updates the page table. For a 4 GiB file that’s over 1 million page faults. Each one is on the order of a microsecond. A full second of fault overhead alone, and the loop is otherwise scanning at full speed.
So mmap saved us the kernel-to-user copy but added a per-page tax.
V5: Hint the kernel: madvise
Maybe the kernel just needs to know what we’re doing:
_ = unix.Madvise(data, unix.MADV_SEQUENTIAL)
_ = unix.Madvise(data, unix.MADV_WILLNEED)
MADV_SEQUENTIAL, “I’m scanning this in order, prefetch aggressively and feel free to drop pages behind me.”MADV_WILLNEED, “Bring these pages in now; don’t make me wait on a cold read.”
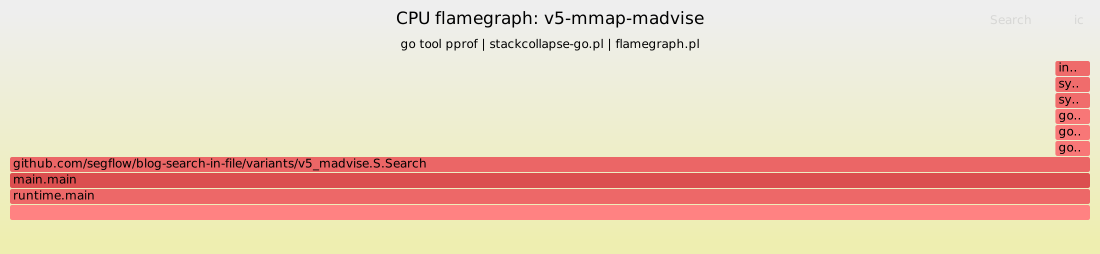
Indistinguishable from mmap (#v4): the flamegraph is one tall stack on S.Search. madvise calls show up as a sliver on the left but buy nothing because the cache is already warm.
Result: 13.2 GB/s, basically identical to mmap (#v4). Why?
Because on a warm cache there’s nothing to prefetch, the pages are already
in RAM. WILLNEED is a no-op when everything is cached, and SEQUENTIAL’s
read-ahead only helps cold reads. The bottleneck wasn’t I/O, it was the
1M+ page faults, which madvise doesn’t touch.
(madvise is great for cold-cache reads, as we’ll see at the end.)
V6: Parallelize the mmap scan
A single goroutine doing scalar uint64 loads tops out around DDR5 single-thread bandwidth. With multiple cores we can issue more parallel cache-line requests and feed more DRAM channels in flight:
nWorkers := runtime.NumCPU() // 12 on this box
per := (totalWords + nWorkers - 1) / nWorkers

var found atomic.Int64; found.Store(-1)
var wg sync.WaitGroup
for w := range nWorkers {
    start, end := ... // shard boundaries
    wg.Add(1)
    go func() {
        defer wg.Done()
        words := unsafe.Slice(..., end-start)
        for i, x := range words {
            if x != 0 {
                // CAS-update the minimum found offset
                ...
                return
            }
        }
    }()
}
wg.Wait()
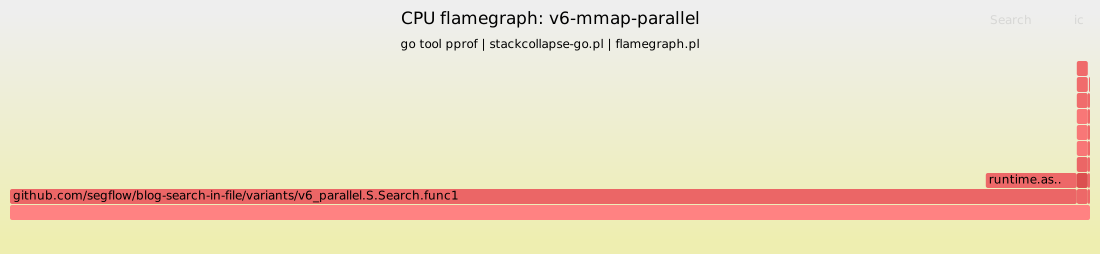
~90% of time is split across the per-goroutine Search.func1 frames doing the scan. The interesting sliver is the ~8% in runtime.asyncPreempt, the runtime stopping goroutines mid-loop for the scheduler. With 12 hot goroutines fighting for 12 logical CPUs, preemption costs become visible.
Result: 28.8 GB/s, 2.2× over mmap + madvise (#v5), 38× over naive os.ReadFile (#v1).
Scaling story: doubles from 11 GB/s (1 worker) to 27 GB/s at 6 cores (2.4x for 6x cores), then plateaus. Past 6 workers, adding more goroutines doesn’t help and sometimes hurts. The cap isn’t CPU or memory bandwidth; it’s contention on the per-process page-fault machinery as twelve goroutines all bring in fresh 4 KiB pages.
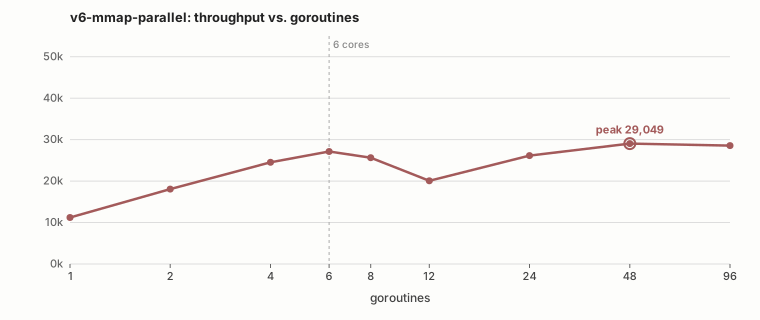
Twelve goroutines also means twelve page-fault streams happening in parallel, so the fault overhead is amortized across cores too.
V7: Wait, what if we go back to pread?
mmap’s only weakness was page faults. What if we use the chunked uint64 (#v3) approach (read
into a buffer) but parallelize that?
Each goroutine gets its own file descriptor, its own 1 MiB buffer, and
preads its shard:
go func(start, end int64) {
    f, _ := os.Open(path)
    defer f.Close()
    buf := make([]byte, 1<<20)
    for off := start; off < end; {
        n, _ := f.ReadAt(buf, off)
        words := unsafe.Slice((*uint64)(unsafe.Pointer(&buf[0])), n/8)
        for i, x := range words {
            if x != 0 { /* report off + i*8, stop */ }
        }
        off += int64(n)
    }
}(start, end)
The trade-off:
- mmap: zero-copy, but page faults.
- pread: copy from page cache to user buffer (extra memory traffic), but the buffer fits in L2 (1 MiB) so the scan reads from L2 rather than DRAM, and there are no faults at all.

75% of time is now in Syscall6, the pread syscall itself. Only ~21% is in the user-side scan loop. We have flipped the cost centre: the bottleneck is no longer the Go code, it is the kernel-to-user copy.
Result: 45.4 GB/s, 1.6× over mmap parallel (#v6), 61× over naive os.ReadFile (#v1). New champion.
Scaling story: this one is unusual. It keeps gaining throughput past NumCPU: from 34 GB/s at 12 workers to 41 GB/s at 24, then plateaus. Each worker spends a chunk of its life inside the kernel doing the pread copy, and extra goroutines let the runtime overlap one worker’s syscall with another worker’s user-side scan.
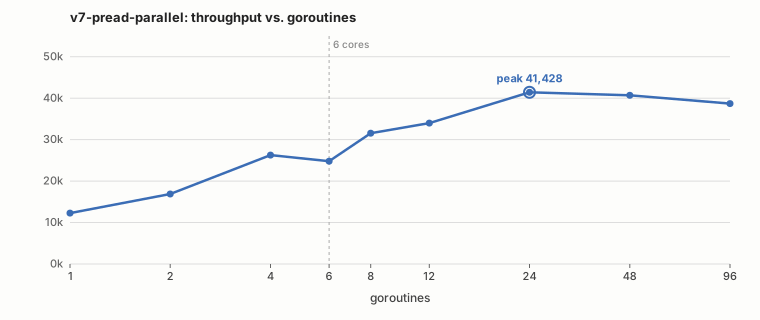
The intuition is counter-intuitive: copying the data is cheaper than
faulting it in, because the kernel copy is one tight rep movsq per
megabyte, which the prefetcher loves, while page faults are a serialized
trap-into-kernel dance.
V8: SIMD with hand-written assembly
The inner loop processes one uint64 per iteration: 1 load + 1 compare +
1 branch = ~3 µops per 8 bytes. Modern x86 can do better: AVX2 lets us touch
32 bytes per instruction, and vptest collapses an OR + branch into a
single op.
A minimal AVX2 kernel in Go assembly:
loop128:
    VMOVDQU (SI)(AX*1),   Y0
    VMOVDQU 32(SI)(AX*1), Y1
    VMOVDQU 64(SI)(AX*1), Y2
    VMOVDQU 96(SI)(AX*1), Y3
    VPOR    Y1, Y0, Y0
    VPOR    Y3, Y2, Y2
    VPOR    Y2, Y0, Y0
    VPTEST  Y0, Y0       // ZF=1 iff Y0 is all zero
    JNZ     found128
    ADDQ    $128, AX
    JMP     loop128
128 bytes per iteration, ~10 µops. The CPU side of the scan is essentially free.
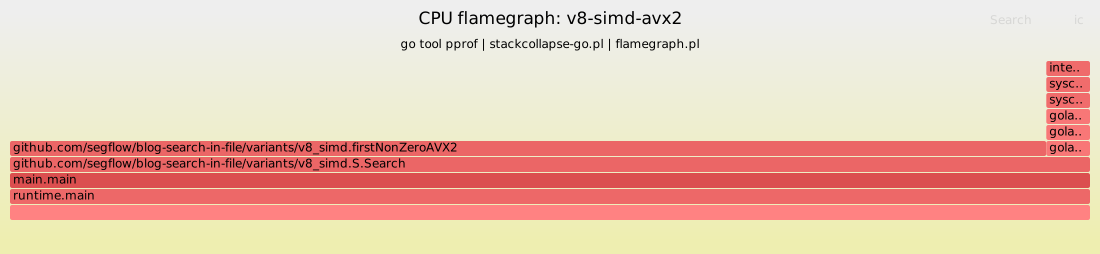
~96% of CPU time is in firstNonZeroAVX2, our hand-written assembly kernel. Everything else (mmap, madvise, scheduling) is negligible. The hot loop is exactly two vmovdqu + a vptest per 32 bytes.
Result (single-thread): 14.6 GB/s vs. 13.2 GB/s for scalar mmap (#v4).
About a 10% win. Not huge, because even a single core’s scalar loop was already hitting most of its memory bandwidth. SIMD made the CPU side faster but the cache-line transfers are still the actual bottleneck.
V9: Parallel mmap + AVX2
If single-thread SIMD bought 10%, parallel SIMD should crush it, right?
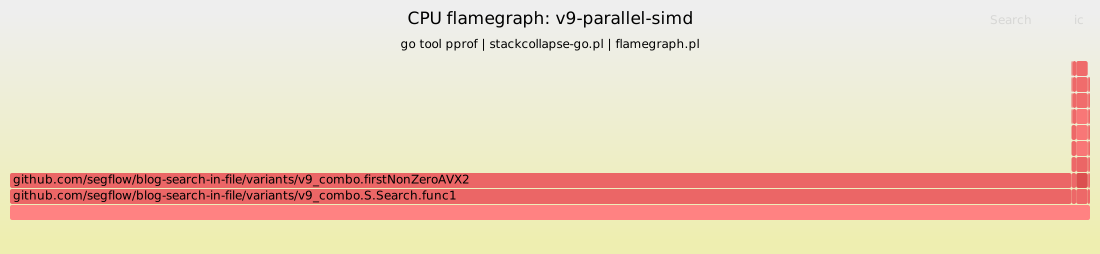
~98% in firstNonZeroAVX2 across all goroutines. Same kernel as AVX2 asm (#v8), just sharded. Notice there is no syscall column at all: everything is mmap-backed memory and the entire wall time is the vector loop chewing through DRAM.
Result: 29.7 GB/s, within noise of scalar mmap parallel (#v6) (28.8 GB/s).
Scaling story: ramps to 28 GB/s at 4 workers and goes flat. Identical ceiling to scalar mmap parallel (#v6) with no SIMD, which is the key insight: the bottleneck is page-fault serialization on the mmap side, so a faster inner loop changes nothing. The CPU is idle waiting for faults to resolve.
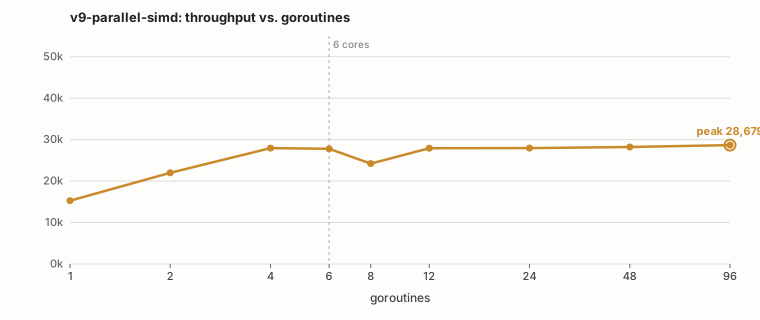
This is the most informative null result of the whole experiment. With 12 cores hitting DRAM in parallel, we are entirely bandwidth-bound. The CPUs spend most of their time waiting on cache lines. Making the CPU side 8× faster doesn’t help when the CPU is asleep half the time anyway.
V10: MAP_POPULATE (it’s a trap)
Linux mmap has a flag MAP_POPULATE that tells the kernel to pre-fault all
pages during the mmap() call itself. Surely that fixes the page-fault
problem?
data, _ := unix.Mmap(int(f.Fd()), 0, size, unix.PROT_READ,
    unix.MAP_SHARED|unix.MAP_POPULATE)
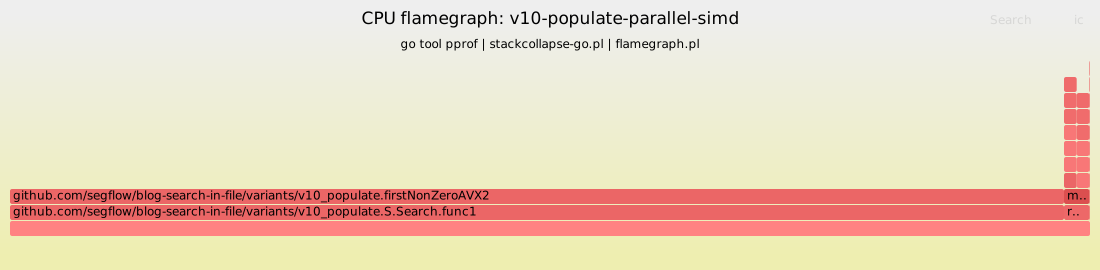
Still ~97% in firstNonZeroAVX2, but the wall clock is worse: the time “missing” from the flamegraph is the single-threaded page-fault walk inside the mmap() syscall during the MAP_POPULATE prologue, which pprof doesn’t sample because blocked syscalls don’t accumulate CPU samples.
Result: 18.3 GB/s, worse than the no-populate version (29.7 GB/s).
MAP_POPULATE walks the page table from a single thread inside the mmap
call. So it serializes all the fault work into one CPU, while mmap parallel + AVX2 (#v9) was
distributing it across 12 goroutines. The total fault work is similar; the
parallelism is lost.
Real lesson: a hint from the kernel manual isn’t always a win.
V11: Parallel pread + AVX2 asm
Combine the pread parallel (#v7) I/O strategy with the AVX2 asm (#v8) scan kernel.
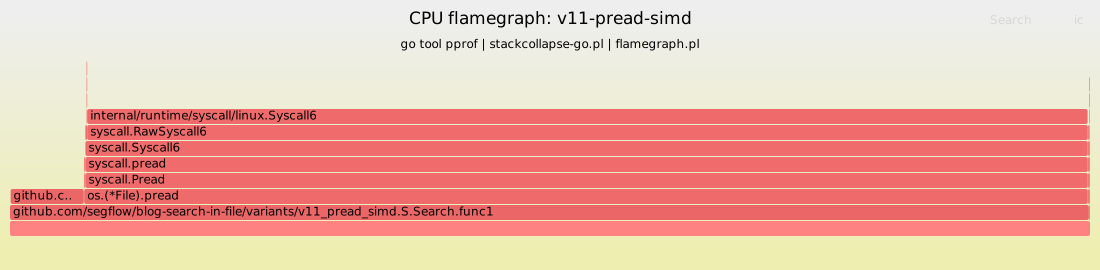
~93% of time is in pread. The AVX2 scan kernel barely registers (<1%) because the data is consumed as fast as the kernel can hand it over. This is what “bandwidth-bound” looks like in a flamegraph: the syscall fills the whole canvas.
Result: 48.6 GB/s. Slight improvement over pread parallel (#v7). We are clearly very close
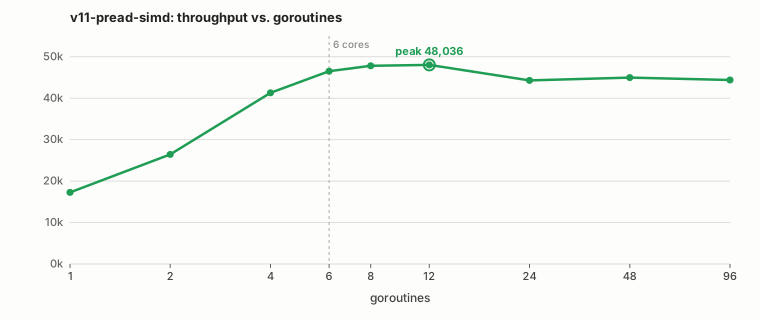
Scaling story: the cleanest curve in the experiment. Doubles every doubling of workers up to 6 cores (17 -> 41 -> 47 GB/s), saturates around 48 GB/s and stays there. Beyond NumCPU the SIMD kernel is too fast for the I/O side to keep up, so extra goroutines have nothing to do.
V12: AVX-512 in pure Go with simd/archsimd
Go 1.26 ships an experimental package, simd/archsimd, that
exposes hardware vector types and operations directly as Go code, no .s
files, no //go:noescape declarations. It’s gated behind
GOEXPERIMENT=simd at build time.
The package gives you typed vector values like Uint8x64 (64 bytes,
AVX-512), methods for arithmetic and comparison, and a Mask8x64 type for
results of compares. Critically, the compiler treats these as intrinsics and
lowers them to single SIMD instructions; no boxing, no allocation.
Re-implementing the scan kernel in pure Go using AVX-512 looks like this:
func scanZero(buf []byte) int {
    const step = 128
    zero := archsimd.BroadcastUint8x64(0)
    n := len(buf) &^ (step - 1)
    for i := 0; i < n; i += step {
        v0 := archsimd.LoadUint8x64((*[64]uint8)(unsafe.Pointer(&buf[i])))
        v1 := archsimd.LoadUint8x64((*[64]uint8)(unsafe.Pointer(&buf[i+64])))
        // Bit = 1 in each lane where the byte == 0.
        m0 := v0.Equal(zero).ToBits()
        m1 := v1.Equal(zero).ToBits()
        if m0 != ^uint64(0) || m1 != ^uint64(0) {
            // Some byte was non-zero. Narrow down with TZCNT on the
            // inverted mask.
            if m0 != ^uint64(0) {
                return i + bits.TrailingZeros64(^m0)
            }
            return i + 64 + bits.TrailingZeros64(^m1)
        }
    }
    for i := n; i < len(buf); i++ {
        if buf[i] != 0 { return i }
    }
    return -1
}
That’s it. 128 bytes per loop iteration, two AVX-512 vector loads, two
compares, two kmovq/ktest, one branch. Zero lines of assembly.
Build it with:
GOEXPERIMENT=simd go build ./...
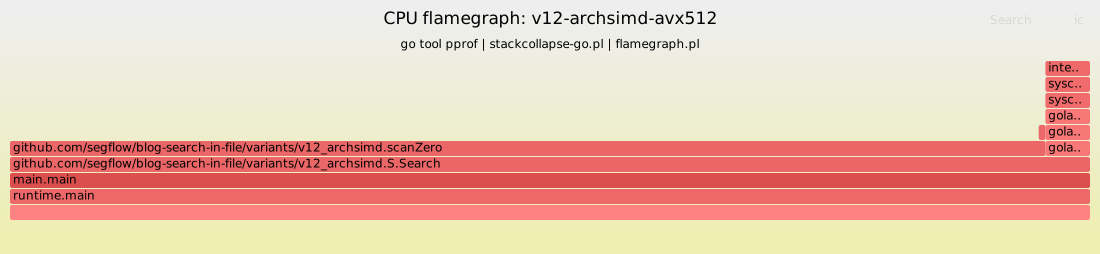
~95% in scanZero, the pure-Go simd/archsimd function. Identical shape to AVX2 asm (#v8)’s profile, just with a Go function name instead of an assembly symbol, confirming the compiler emitted a real AVX-512 inner loop with no scaffolding overhead.
Result (single thread): 15.6 GB/s, 7% faster than the AVX2 asm of AVX2 asm (#v8) (14.6 GB/s). The wider 512-bit vector buys you a bit more, but again we’re memory-bound so the win is modest.
The remarkable thing is not the speed, it’s that pure Go matched
hand-written assembly. The archsimd API is admittedly verbose and the
compiler intrinsics are early-days, but for tight, hot kernels it’s already
production-grade. No more dropping into .s files for the common cases.
V13: Parallel pread + archsimd
The final boss: pure Go end to end. The pread parallel (#v7) I/O skeleton
with the pure-Go AVX-512 kernel from archsimd AVX-512 (#v12) as the
inner loop.
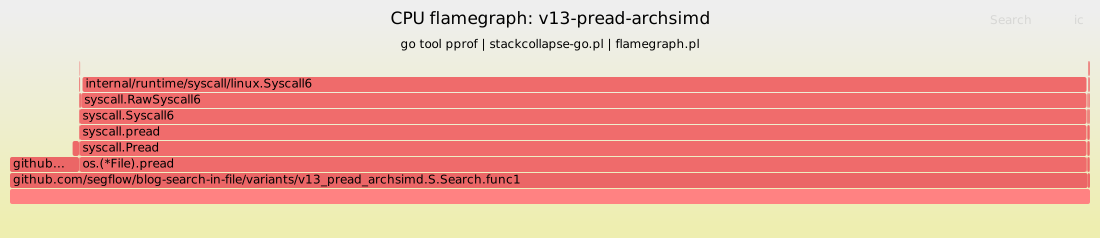
Indistinguishable from pread parallel + AVX2 asm (#v11): ~93% in pread, the rest is noise. The pure-Go vector kernel is so cheap it doesn’t even show up next to the kernel copy.
Result: 49.3 GB/s, 66× over naive os.ReadFile (#v1), the new champion.
Scaling story: indistinguishable from pread parallel + AVX2 asm (#v11). Hits ~48 GB/s at 8 goroutines and stays there. We are wall-clocked by the kernel pread + copy_to_user path, not by anything the user-side code (scalar, AVX2, or AVX-512) can change.
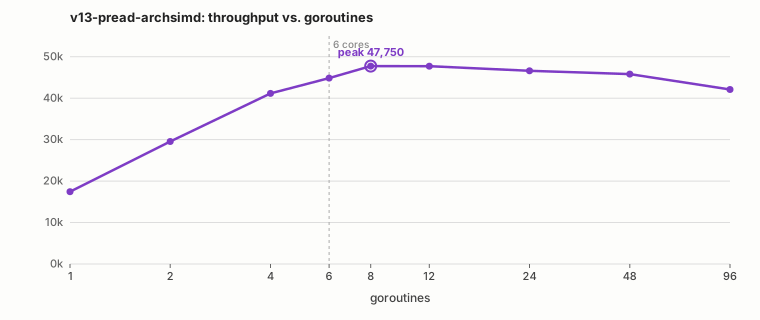
Within noise of the asm version (pread parallel + AVX2 asm (#v11) at 48.6 GB/s), as expected, we are pinned against DRAM bandwidth at this scale and any extra CPU work is free.
Scaling summary: all variants on one chart
Each parallel variant got its own scaling chart up above. Here they all are together for a quick comparison. I ran each variant at 1, 2, 4, 6, 8, 12, 24, 48 and 96 workers, trimmed mean of 5 runs each, same 4 GiB warm-cache file.
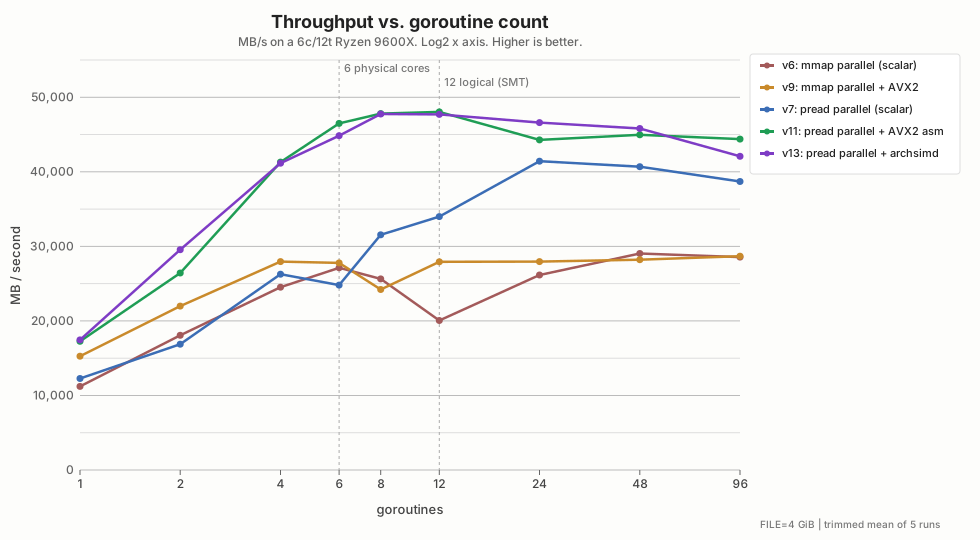
| # | Variant | 1 worker | Peak | Peak at |
|---|---|---|---|---|
| v6 | mmap, parallel | 11,219 | 29,049 | 48 |
| v7 | pread, parallel | 12,274 | 41,428 | 24 |
| v9 | mmap parallel + AVX2 | 15,266 | 28,679 | 96 |
| v11 | pread parallel + AVX2 asm | 17,269 | 48,036 | 12 |
| v13 | pread parallel + archsimd | 17,446 | 47,750 | 8 |
Three patterns:
- pread parallel + AVX2 asm (#v11) and pread parallel +
archsimd(#v13) scale the cleanest. Both reach their peak (~48 GB/s) at 8-12 goroutines and stay flat after that. The SIMD scan keeps up with the kernelpread; adding workers stops helping the moment DRAM bandwidth is saturated. - pread, parallel (#v7) is the only one that keeps scaling well past
NumCPU, all the way to 24 goroutines. Each worker spends real time blocked insidepread, so extra goroutines let the Go runtime overlap one worker’s syscall with another worker’s user-side scan. - mmap parallel (#v6) and mmap parallel + AVX2 (#v9) plateau early and low, around 28 GB/s. Adding SIMD on top doesn’t move the needle. The cap is page-fault serialization on the process-wide mmap state, not CPU.
Nothing scales linearly past 4 workers. Even the best variants only double from 4 -> 12. The real wall is DRAM bandwidth (~50 GB/s on a single CCX of this DDR5 box) for the pread-SIMD variants, and mmap-side fault contention for the mmap variants.
The scoreboard (warm cache, 4 GiB)
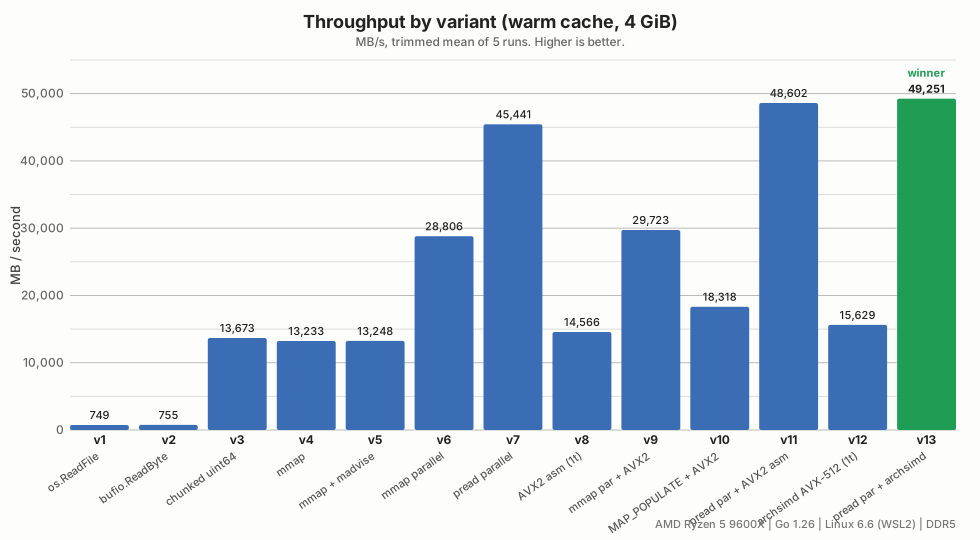
| # | Variant | Mean (s) | MB/s | Speedup |
|---|---|---|---|---|
| v1 | os.ReadFile + range | 5.731 | 749 | 1.0× |
| v2 | bufio.ReadByte | 5.691 | 755 | 1.0× |
| v3 | Chunked read + uint64 scan | 0.314 | 13,673 | 18× |
| v4 | mmap | 0.325 | 13,233 | 18× |
| v5 | mmap + madvise | 0.324 | 13,248 | 18× |
| v6 | mmap, parallel | 0.149 | 28,806 | 38× |
| v7 | pread, parallel | 0.095 | 45,441 | 61× |
| v8 | AVX2 asm (single thread) | 0.295 | 14,566 | 19× |
| v9 | mmap parallel + AVX2 | 0.145 | 29,723 | 40× |
| v10 | mmap MAP_POPULATE + AVX2 | 0.234 | 18,318 | 24× |
| v11 | pread parallel + AVX2 asm | 0.088 | 48,602 | 65× |
| v12 | archsimd AVX-512 (single thr.) | 0.275 | 15,629 | 21× |
| v13 | pread parallel + archsimd | 0.087 | 49,251 | 66× |
A few patterns jump out:
- The biggest wins came from boring things: bigger buffers (chunked
uint64(#v3)), parallelism (mmap parallel (#v6), pread parallel (#v7)), and not paying per-byte function call cost. - mmap is not magic. It’s a different trade-off, saves the kernel copy
but adds page-fault tax. Below a few GB it usually wins. At 4 GB on a warm
cache it loses to plain
pread. - SIMD only helps if you’re not already memory-bound. We hit ~16 GB/s single-thread with AVX-512, but the parallel version is bandwidth-capped and gets nothing from it.
- Kernel hints can backfire.
MAP_POPULATEmade things worse. simd/archsimdis real. You can write SIMD in pure Go and match a hand-written asm kernel. No.sfiles.
Cold-cache bonus round
So far the file was in the page cache, so we were measuring memory bandwidth plus loop overhead, not disk. Let’s actually read from the SSD and see what changes.
| # | Variant | Warm MB/s | Cold MB/s |
|---|---|---|---|
| v1 | os.ReadFile + range | 749 | 491 |
| v3 | Chunked read + uint64 scan | 13,673 | 2,030 |
| v6 | mmap, parallel | 28,806 | 3,304 |
| v7 | pread, parallel | 45,441 | 4,562 |
| v11 | pread parallel + AVX2 asm | 48,602 | 4,529 |
| v13 | pread parallel + archsimd | 49,251 | 5,045 |
Three things to notice:
- Parallel
preadstill wins by a 2x margin. Multiple in-flight reads let the SSD’s NVMe queue earn its keep, while a single-threaded reader gets one request in flight at a time. - mmap-parallel falls further behind: page faults are now waiting on actual disk I/O, and the per-process fault-handler serialization prevents the SSD from seeing more than a few outstanding requests.
- SIMD is invisible: at SSD speeds the CPU is asleep most of the time
waiting for the controller to ship the next chunk. pread parallel + AVX2 asm (#v11) and pread parallel +
archsimd(#v13) are indistinguishable from scalar pread parallel (#v7).
If you genuinely care about cold-cache reads, the next moves would be:
O_DIRECTto bypass the page cache entirely, with aligned buffers read straight into user memory.io_uringto keep dozens of reads in flight without one syscall per read.O_DIRECT+io_uringis how modern databases squeeze every IOPS out of NVMe.
Both are largely irrelevant for warm cache. pread-parallel already
saturates the page-cache to userland path.
What I learned
- Measure before reaching for clever tools. Streaming
preadwith a 1 MiB buffer beat mmap. SIMD beat nothing once we were memory-bound. - Parallelism beats single-thread SIMD for memory-bound workloads. One
well-placed
goroutineper core was worth more than every other optimization combined. - mmap’s per-page fault cost is real, and the workarounds
(
MAP_POPULATE, huge pages) come with their own gotchas. simd/archsimdlets us write portable, type-safe SIMD in pure Go, and it competes with hand-written assembly. This is a quiet but huge shift for Go 1.26.- The wall is DRAM bandwidth. Once you’re there, the only way forward is to read less data or buy faster memory.
The full code, the asm kernel, the archsimd kernel, the benchmark harness,
and the per-variant write-ups are in
browsable on GitHub.
Reproduce on your own machine and let me know what the wall looks like over
there.