After my map-lookup contribution to the Go compiler back in April, I kept poking the toolchain whenever a benchmark surprised me. Last week it surprised me again, and the lesson is short enough to fit in one post: Go inlines aggressively, but not infinitely, and the shape of your function matters more than its length.
The story starts with a three-line helper that I was sure the compiler would
inline. pprof disagreed.
A “tiny” helper that was still a call
I had something like this on a very hot path:
func (c *counter) addDefer(d int) int {
    defer func() {}()
    c.n += d
    return c.n
}
Yes, the empty defer is silly. It’s a stand-in for “we used to hold a lock
here”, which is the real story. The point is: the body is three lines.
Surely the compiler inlines it.
pprof showed addDefer as a real frame, sitting there eating samples.
Time to ask the compiler what it actually thinks.
Asking the compiler: -gcflags="-m=2"
The Go compiler will happily tell you what it inlined and what it refused to.
-m prints decisions, -m=2 adds the reason. Same trick I leaned on in
the April post, just turned up a notch.
On a clean tiny function it looks like this:
$ go1.15 build -gcflags="-m=2" ./small.go
./small.go:4:6: can inline clamp with cost 14 as: func(int, int, int) int { ... }
./small.go:14:6: can inline UseClamp with cost 20 as: ...
./small.go:15:14: inlining call to clamp ...
Two things to notice. First, “can inline X” is a property of the callee: the compiler decided this function is cheap enough to be a candidate. Second, “inlining call to X” is the actual event at the call site. Both have to show up before you’ve truly inlined anything.
And there’s that word: cost. Every function gets a number.
The mental model: a budget of 80
Inside the compiler (cmd/compile/internal/gc/inl.go in the 1.15 tree),
every AST node has a cost. Most statements and expressions cost 1, calls
cost more, builtins are special-cased. The walker sums them up. If the
total exceeds 80, the function is rejected as “too complex”.
Easy to demo. I built a function that does just enough arithmetic to bust the limit:
func tooBig(a, b, c, d, e, f int) int {
    x := a + b
    x = x*c - d
    x = x + e - f
    // ... a handful more lines ...
    return x
}
./budget.go:4:6: cannot inline tooBig: function too complex: cost 86 exceeds budget 80
86 vs 80. Six points over and you stay a call. Sobering, given how innocent the source looks.
What kills inlining instantly
The budget isn’t the only gate. Some statements set off a hard veto, no
matter how short the function is. In Go 1.15, the obvious offenders are
defer, recover, go, select, and type switches. Here’s all five
in one file:
func WithDefer(x int) int      { mu.Lock(); defer mu.Unlock(); return x + 1 }
func WithRecover() (err error) { defer func() { recover() }(); return nil }
func WithGo(x int) int         { go func() { _ = x }(); return x }
func WithSelect(c chan int) int {
    select { case v := <-c: return v; default: return 0 }
}
func WithTypeSwitch(x interface{}) int {
    switch v := x.(type) { case int: return v; case string: return len(v) }
    return 0
}
-m=2 lays it out, one veto per line:
./killers.go:8:6:  cannot inline WithDefer:      unhandled op DEFER
./killers.go:15:6: cannot inline WithRecover:    unhandled op DEFER
./killers.go:25:6: cannot inline WithGo:         unhandled op GO
./killers.go:31:6: cannot inline WithSelect:     unhandled op SELECT
./killers.go:41:6: cannot inline WithTypeSwitch: unhandled op TYPESW
“unhandled op” is the compiler saying: the inliner doesn’t know how to
copy this construct into the caller, so it gives up before even looking
at the cost. Notice recover shows as DEFER: the recover is just the
payload, the defer is what the inliner stops on.
This is the part that bit me. My helper’s body cost was about 12. Plenty
of headroom. But the defer flipped a different switch entirely. Cost
didn’t matter, because cost was never asked.
Mid-stack inlining: the part that does work
It’s not all bad news. Since Go 1.12, the compiler does mid-stack inlining: a function that calls another inlineable function can itself be inlined, so a whole chain can collapse into the caller. Watching three levels disappear is genuinely satisfying:
func leaf(x int) int   { return x * 3 }
func middle(x int) int { return leaf(x) + 1 }
func top(x int) int    { return middle(x) - 2 }

func CallTop(x int) int { return top(x) }
./midstack.go:7:37: inlining call to top
./midstack.go:7:37: inlining call to middle
./midstack.go:7:37: inlining call to leaf
Three calls in the source, zero calls in the assembly. The whole stack
folds into CallTop, ending up as (x*3 + 1) - 2 after constant folding
and SSA. This is also why ripping a defer out of a small helper has an
outsized effect: you don’t just save the defer machinery, you also let
mid-stack inlining propagate up the chain.
The fix, and the numbers
Back to the real helper. The defer only existed because a long-gone
ancestor used to hold a lock. The current version did nothing on the way
out. So I deleted it:
func (c *counter) addPlain(d int) int {
    c.n += d
    return c.n
}
-m=2 now says what I wanted to see all along:
./bench_test.go:8:6:  cannot inline (*counter).addDefer: unhandled op DEFER
./bench_test.go:14:6: can inline (*counter).addPlain with cost 7 ...
./bench_test.go:32:18: inlining call to (*counter).addPlain ...
The benchmark, five runs each at -benchtime=2s:
$ go1.15 test -bench=. -count=5 -benchtime=2s
BenchmarkAddDefer-12   838211666   2.80 ns/op
BenchmarkAddDefer-12   864690175   2.78 ns/op
BenchmarkAddDefer-12   882135315   2.92 ns/op
BenchmarkAddDefer-12   819684825   2.92 ns/op
BenchmarkAddDefer-12   825036586   2.98 ns/op
BenchmarkAddPlain-12  1000000000   0.988 ns/op
BenchmarkAddPlain-12  1000000000   0.891 ns/op
BenchmarkAddPlain-12  1000000000   0.895 ns/op
BenchmarkAddPlain-12  1000000000   0.885 ns/op
BenchmarkAddPlain-12  1000000000   0.887 ns/op
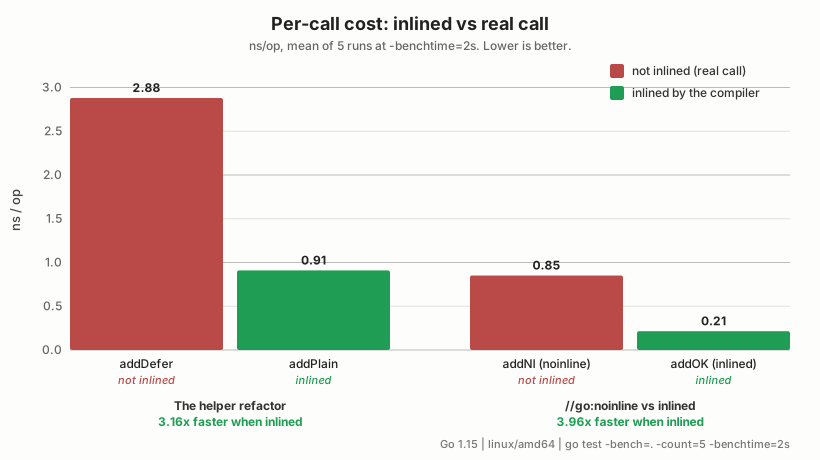
Means: 2.88 ns/op vs 0.91 ns/op. About 3.17x faster, or roughly 2 ns
shaved off every single call. Go 1.14 made defer dramatically cheaper
than it used to be, but cheap is not free, and “not inlineable” is the
bigger tax in a hot loop.
When you actually want to block inlining
A small warning before you delete every defer in your codebase. Inlining
can hide costs you’re trying to measure. Compare these two:
//go:noinline
func addNI(a, b int) int { return a + b }
func addOK(a, b int) int { return a + b }
BenchmarkInlined-12     1000000000   0.215 ns/op
BenchmarkNoinlined-12   1000000000   0.851 ns/op
addOK “costs” 0.21 ns/op only because the inliner plus SSA basically
folded the whole loop into a constant. That number is a lie if you’re
trying to measure a function call. //go:noinline is the right tool for
benchmarks where you need a real call frame, and for coverage tools that
expect distinct functions to attribute hits to.
Takeaways
A few things I keep on a sticky note now:
- Inlining is cheap to see.
go build -gcflags="-m=2"is the first thing to try when a “tiny” function shows up in a profile. - The cost budget in 1.15 is 80. Most short functions are far under;
the ones that aren’t tend to have a
forloop with many ops. defer,recover,go,select, and type switches are hard vetos. If your helper has one of those, length is irrelevant.- Mid-stack inlining is real and powerful. Removing a single veto can unlock several levels of inlining above it.
//go:noinlineexists for a reason. Use it when you want to measure, not when you want to ship.
Next time pprof points at a three-line function, my first move isn’t
“rewrite the body”. It’s -m=2, and a careful look at whether anything
in there is on the veto list.