
The CLI was fast. I had benchmarked it on my laptop, on a fresh clone of the repo, and it finished in well under a second. Then a coworker pointed it at a real monorepo, the kind with 30,000 files spread across a few thousand directories, and the thing crawled. Same code, same machine class, just more files. The user-visible work had not changed. The wall clock had.
This is the story of the half hour I spent figuring out why, what strace -c
showed me, and why I now reach for it before any profiler when something
“feels slow” on Linux.
My first instinct was wrong, by the way. I assumed disk. The repo was big, the laptop has an NVMe drive but it is not magic, and “more files” sounds like “more IO.” So I ran the program twice in a row, expecting the second run to be fast off the page cache. It was not. Both runs took roughly the same time. Whatever was slow, it was not waiting on the disk.
The suspect
The CLI is small. It walks a directory tree, counts non-empty lines in every text file, and prints the total. The Go reads like the kind of code you write once and never look at again:
err := filepath.Walk(root, func(p string, info os.FileInfo, err error) error {
    if err != nil || info.IsDir() {
        return nil
    }
    if !parentsOK(p) {
        return nil
    }
    n, err := countLines(p)
    if err == nil {
        total += n
    }
    return nil
})
parentsOK walks up from the file, calling os.Stat on every ancestor,
because two years ago a bug report blamed a missing parent directory and
somebody added a belt-and-braces check. Nobody ever took it out.
countLines opens the file and uses a bufio.Scanner with a 1 KiB scratch
buffer, because that is what the example in the docs uses.
On a synthetic tree of 30,600 files in 1,861 directories, totalling 224 MiB,
the CLI takes about 320 ms with a warm cache. That sounds fine. It is not
fine, and strace -c is going to tell us why.
The 30-second tool
strace -c does not print every syscall. It runs your program to completion
and prints a histogram of which syscalls were made, how often, and how much
time the kernel spent in each. The crucial flag for Go is -f, “follow
child threads,” because the Go runtime is multi-threaded and without -f
you only see the main thread’s syscalls.
$ strace -cf ./slow /tmp/many >/dev/null
% time     seconds  usecs/call     calls    errors syscall
------ ----------- ----------- --------- --------- ------------------
 81.19  154.531378        6883     22448      1839 futex
 11.21   21.329266         189    112511           nanosleep
  2.92    5.565586          25    216061           newfstatat
  2.53    4.819692          24    194731           read
  0.56    1.071126          32     32462           openat
  0.47    0.901634         168      5364         5 epoll_pwait
  0.42    0.807935          24     32462           close
  0.37    0.697828          21     32462     32461 epoll_ctl
  ...
------ ----------- ----------- --------- --------- ------------------
100.00  190.331611         286    664447     34393 total
A few notes on reading this table before we panic at the numbers. The
seconds column is heavily inflated by strace itself; ptrace is expensive
and the wall time you see here is not the wall time of the unstraced program.
The columns I actually trust are calls, errors, and the relative shape of
the histogram. Always cross-check wall time with /usr/bin/time outside of
strace.
With that caveat, here is what jumps out.
Look at the rightmost columns first. calls is how many times the kernel was
entered, period. It does not lie, it is not warped by ptrace overhead, and
it is the number you can reason about. The errors column is the count of
calls that returned a non-zero error code; a huge value there usually means
the program is using errors as control flow, which is its own kind of slow.
The smoking gun
For 30,600 files, the program made 216,061 newfstatat calls. That is
roughly seven stat per file. Where do seven stats per file come from?
parentsOK("/tmp/many/grp00/sub00/file_00.txt")
  stat("/tmp/many/grp00/sub00/file_00.txt")
  stat("/tmp/many/grp00/sub00")
  stat("/tmp/many/grp00")
  stat("/tmp/many")
  stat("/tmp")
  stat("/")
Six stats from parentsOK, plus one lstat from filepath.Walk as it
descends into each entry. Six plus one is seven. The math closes on the dot.
The second worst row is read: 194,731 calls, which is about 6.3 reads
per file for files that average 6 KiB. The bufio.Scanner is doing its job,
but its scratch buffer is so small that even modest files come back in five
or six chunks. Each chunk is a separate syscall, each syscall is a separate
trip into the kernel and back, and for tiny files that round trip is the
dominant cost.
openat and close come in at 32,462 each. That is one open and one close
per file, plus a couple of thousand for directories. There is nothing to fix
there. You cannot read a file without opening it. But the ratio is telling:
read is 6× the file count, stat is 7× the file count. Every extra
syscall is overhead the program does not need.
Also worth noting: futex is at the top with 81% of the (inflated) seconds.
That is the Go runtime’s scheduler talking to itself across goroutines. On a
ptrace-slowed run it always looks dramatic, because every context switch
becomes a futex storm of its own. Without strace, the runtime barely
shows up. This is one of those places where you have to know what your
language emits as syscalls before you can read its histogram.
Five syscalls you do not want to see in the top three
Before the fix, a short rule of thumb that has held up for me:
stat,lstat,newfstatat: usually means you are checking the same paths over and over. Cache it, or trust theDirEntryyou already have.readwith a huge call count and a smallusecs/call: your buffer is too small or you are reading one byte at a time. Bump the buffer.openat/closepairs hugely exceeding the file count: you are opening the same file more than once. Open once, pass the fd.getdents64running into the thousands for a flat directory: you are listing the same directory repeatedly. Cache the entries.futexdominating wall time with hundreds ofusecs/call: lock contention. Profile withpprof, notstrace.
The fix
Two changes. The first deletes parentsOK entirely. filepath.Walk already
gives me an os.FileInfo per entry and WalkDir does even better by handing
me a fs.DirEntry that was populated from getdents64 without a stat. If
the user mis-typed the root, I will find out at os.Open time.
The second swaps the bufio.Scanner with a tiny buffer for a bufio.Reader
sized at 64 KiB. Almost every text file in this tree fits in a single read.
err := filepath.WalkDir(root, func(p string, d fs.DirEntry, err error) error {
    if err != nil || d.IsDir() {
        return nil
    }
    n, err := countLines(p) // now uses bufio.NewReaderSize(f, 64*1024)
    if err == nil {
        total += n
    }
    return nil
})
Same input, same output (2,447,945 non-empty lines either way). New
strace -c summary:
$ strace -cf ./fast /tmp/many >/dev/null
% time     seconds  usecs/call     calls    errors syscall
------ ----------- ----------- --------- --------- ------------------
 78.04   43.335523        2863     15135      1625 futex
 13.32    7.394392         247     29903           nanosleep
  2.60    1.442270          23     61203           read
  1.81    1.004006          30     32462           openat
  1.42    0.786105          24     32462           close
  1.17    0.651540          20     32462     32461 epoll_ctl
  ...
  0.00    0.000102         102         1           newfstatat
------ ----------- ----------- --------- --------- ------------------
100.00   55.532420         255    217161     34134 total
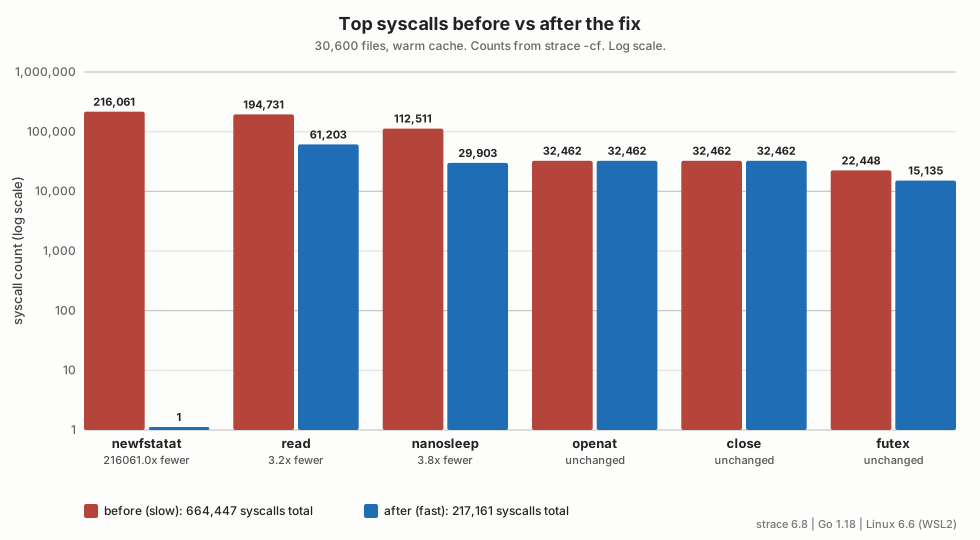
newfstatat went from 216,061 to 1. That single stat is Go’s runtime
checking the root directory I passed on the command line. The whole rest of
the walk runs off getdents64 and the d_type byte. read dropped from
194,731 to 61,203, which is closer to two reads per file: one to grab the
contents, one to hit EOF and stop. Total syscalls dropped from 664,447
to 217,161, a 3× reduction. Wall time outside strace dropped from a
steady 320 ms to a steady 270 ms.
The wall-time win is real but modest, and that is worth saying plainly. With a warm page cache, a syscall is cheap; the kernel’s stat fast path is a handful of hundred nanoseconds. The reason this matters anyway is two fold. First, syscall count scales with input size. On a tree ten times bigger the slow version would have made 2.16 million stats and the fast version still just one; the gap would not have stayed at fifty milliseconds. Second, on a cold cache, every stat that misses the dentry cache turns into a directory read on disk, and that is where this style of code falls off a cliff. I cannot drop the page cache on this machine to demo it, but I have been bitten by it on production CI runners more than once.
What strace -c is and is not
strace -c is not a profiler. It is a histogram. It will not tell you that
80% of your CPU is in a regex compiler or that a map lookup is going
quadratic. For that, go test -cpuprofile and pprof are still the right
tools.
What strace -c is good at is one specific question: is my program
spending its life in syscalls it does not need? That is a question CPU
profilers answer badly, because most of the time hides inside the kernel
and barely registers in a user-space profile. A 30-second strace -c run
gives you a syscall histogram, and once you see the histogram, the obvious
calls jump out: the stat storm, the tiny read, the redundant openat.
Two warnings before you go.
First, strace uses ptrace. Ptrace adds a context switch on every syscall,
which is why my wall times inside strace looked like 190 seconds for a
program that runs in 0.3 seconds. Never quote strace wall times as if
they were real. Use it for the call counts and ratios, then measure wall
time separately.
Second, on a production box, strace is the wrong tool. It pauses every
syscall and can wreck latency. For production triage, reach for perf trace --summary, which uses tracepoints and is far cheaper. But on my laptop,
on a Friday afternoon, with a CLI that “feels slow,” strace -cf is still
the first thing I run.
The fix to my slow CLI took ten minutes once I had the histogram. Finding
the histogram took thirty seconds. That ratio is why I keep coming back to
strace -c.